Project type: Data visualization
Tools: Photoshop
Date: Winter 2017
Timeline: One week
Portfolio / A Life in Light
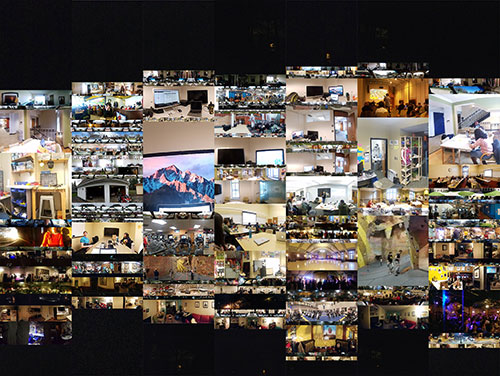
Representation of one week of life using panoramic images, scaled by height over time
I created a work that visualizes the visible qualities of my life - the variations in light and color I perceive - and quantifies the amount of time I spend in different types of visual environments. A single photograph represents each space I spent time in - and the size of the photograph represents the amount of time I spent in that space.
For a full week, each time I entered a new space (that I would remain in for more than then minutes) I took a panorama photo with my cell phone of that space. The photo filenames contained timestamps that I used to create a table listing where I was and for how long. I combined the resulting 180 photos onto an image with seven columns - each representing a different day of the week. Individual photos were scaled by height and cropped, when necessary, to maintain a constant width. The result is a visual timeline of my week, with each day beginning and ending at 4 AM. Each column is bookended by a lengthy section “black space” - a photograph of my bedroom at night - indicating the time when I was sleeping. Each day produced variety - I created as few as 15-20 images two days and over 45 on a day when I ran many errands.
Due to the size distortion that comes with scaling a photograph in this manner, spaces where I spent the most time simultaneously appear larger and “cropped” - with the edges removed - increasing the importance the items that sat directly in front of me in those spaces (and are therefore in the center of the photograph). In most cases, I was stationary for long periods of time while working on projects/focusing on tasks - the magnification of items that appear in these photographs creates a sense of “tunnel vision” that matches my actions in those environments.
Spaces in which I pass through quickly - usually walking or in the car - were included in their entirety with no cropping. These photos, primarily of of outdoor spaces – architecture, trees, lights, and changing subjects– are the most interesting from the set. However, due to their small size, these “transition” photos are sandwiched between larger blocks of time and difficult to see. Reflecting back on the visualization motivates me to pay more attention to my surroundings and to affect a stronger physical presence in the world I exist in.
From the data I’ve gathered (spaces stayed and time spent in each space), it would be simple to create a treemap visualization, aggregating time spent in each place over the course of the week, and using a single image to represent each potential space. This type of representation would provide me with different feedback - and have a different emotional effect. With each space represented by one photograph, this visualization would use fewer total photographs and show me the total amount of time I spent in each space during the week. Places I visit repeatedly would rise in prominence. I expect to see the combined time during “transition” periods produce a more recognizable image. With large items grouped together (as a treemap requires) the tunnel vision effect of “focusing” spaces would be emphasized to a greater degree.
